Satellite Crop Data API – Smart Crop Monitoring
Original price was: ₹45,000.00.₹30,000.00Current price is: ₹30,000.00.
The Satellite Crop Data API empowers agriculture platforms with satellite-based crop monitoring, vegetation index analytics, field-level insights, seasonal comparisons, climate and drought impact analysis, and GIS-powered map visualization—all delivered through a robust API.
This API is ideal for agri-tech platforms, farm management systems, precision agriculture tools, crop advisory services, research institutions, and developers building satellite-driven agriculture solutions.
Description
Modern agriculture increasingly depends on accurate, large-scale, and real-time crop intelligence. Traditional field inspections alone cannot provide continuous visibility into crop health, seasonal changes, or climate-driven risks across vast farming areas.
Satellite-based crop monitoring bridges this gap by offering high-resolution, consistent, and scalable insights. Vegetation indices such as NDVI and EVI help assess crop vigor, detect stress, and track growth patterns throughout the season.
The Satellite Crop Data API empowers agriculture platforms with satellite-based crop monitoring, vegetation index analytics, field-level insights, seasonal comparisons, climate and drought impact analysis, and GIS-powered map visualization—all delivered through a robust API.
This API is ideal for agri-tech platforms, farm management systems, precision agriculture tools, crop advisory services, research institutions, and developers building satellite-driven agriculture solutions.
⚙️ How the Satellite Crop Data API Works
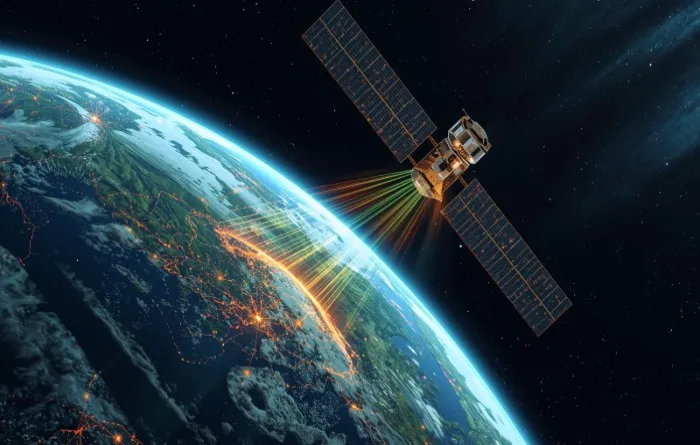
The Satellite Crop Data API functions as a high-precision satellite intelligence and crop analytics engine, converting raw Earth observation data into actionable agricultural insights.
- 🛰️ Satellite-Based Crop Monitoring
- The API retrieves high-resolution multispectral imagery from satellite constellations (like Sentinel or Landsat) to provide a continuous “eye in the sky” over your fields.
- 🌿 NDVI, EVI & Vegetation Indices
- By analyzing light reflectance, the API calculates key indices like NDVI (biomass) and EVI (vigor) to detect plant health before issues are visible to the naked eye.
- 📍 Field-Level Crop Analytics
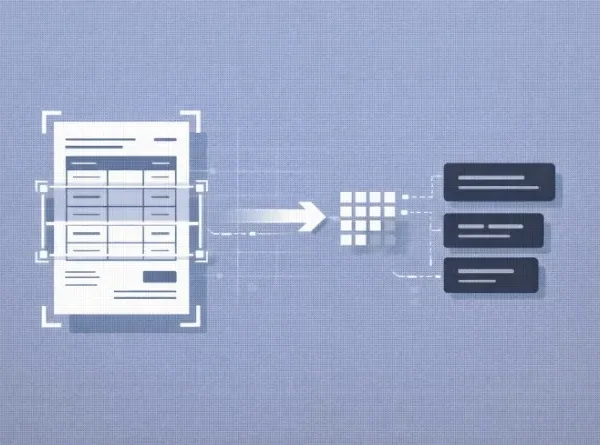
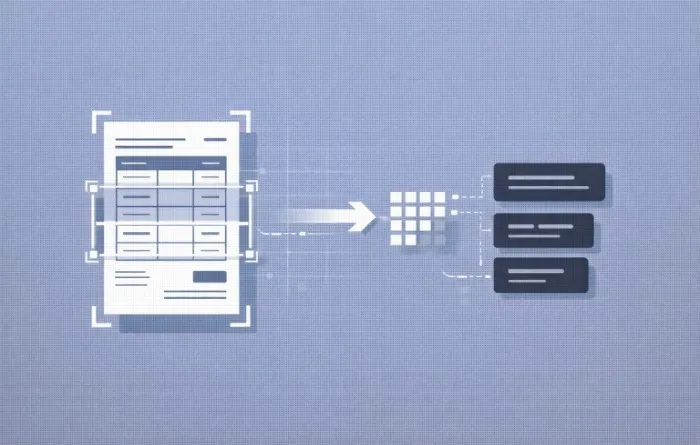
- Raw data is clipped and processed for individual farm boundaries, providing granular insights into specific management zones and localized crop performance.
- ⏳ Seasonal Crop Comparison
- Users can access historical archives to compare current growth stages against previous years, helping to identify long-term soil productivity or yield trends.
- 🏜️ Climate & Drought Impact Analysis
- The API correlates vegetation health with moisture levels to assess drought stress and quantify the impact of extreme climate events on total biomass.
- 🗺️ GIS & Map-Based Visualization
- Complex data is delivered via structured JSON or WMS layers, enabling easy integration into interactive maps, dashboards, and Geographic Information Systems.
This workflow bridges the gap between raw space-borne data and ground-level farming decisions.
💎 Key Features
- 🛰️ Satellite-based crop monitoring
- 🌿 NDVI, EVI & vegetation indices
- 📍 Field-level crop analytics
- ⏳ Seasonal crop comparison
- 🏜️ Climate & drought impact analysis
- 🗺️ GIS & map-based visualization
💼 Business Benefits
- 🛰️ Monitor crops remotely using satellite data
- 🌿 Detect crop stress early using vegetation indices
- 📊 Compare crop performance across seasons
- 🏜️ Understand climate and drought impact on fields
- 🚀 Enable precision agriculture at scale
- 🗺️ Enhance decision-making with GIS visualization
🏭 Use Cases & Industries
- 🌾 Agriculture & Farming Platforms
- Crop health monitoring dashboards
- Large-scale field analysis
- 🚜 Farm Management Systems
- Field-level crop performance tracking
- Seasonal comparison reports
- 📱 Agri-Tech & Advisory Apps
- Satellite-driven crop insights
- Precision farming tools
- 🌍 Research & Agricultural Institutions
- Climate and drought impact studies
- Vegetation trend analysis
- 🧩 Developers & Smart Farming Platforms
- Satellite data-driven agriculture apps
- GIS-based crop intelligence systems
🔍 Comparison: Satellite Crop Data API vs Manual Field Monitoring
| Aspect | Satellite Crop Data API | Manual Monitoring |
|---|---|---|
| Coverage | ✅ Large-scale (Global/Total area) | ❌ Limited (Sample points only) |
| Data frequency | ✅ Continuous (Regular revisits) | ❌ Periodic (Labor dependent) |
| Vegetation indices | ✅ NDVI & EVI (Scientific) | ❌ Not available (Subjective) |
| Seasonal analysis | ✅ Supported (Historical logs) | ❌ Manual (Memory-based) |
| Climate impact | ✅ Included (Data-driven) | ❌ Limited (Observational) |
| Visualization | ✅ GIS-based (Interactive maps) | ❌ Static (Reports/Notes) |
⭐ Why Choose This Satellite Crop Data API
- 🛰️ High-frequency, multispectral satellite-based crop monitoring.
- 🌿 Advanced NDVI, EVI, and specialized vegetation index analytics.
- 📍 Targeted field-level crop health and vigor insights.
- ⏳ Automated seasonal crop performance benchmarking.
- 🏜️ Sophisticated climate and drought impact analysis tools.
- 🔌 Robust GIS and interactive map-based visualization layers.
This API is built for precision agriculture platforms that require scalable, accurate, and climate-aware crop intelligence.
❓ FAQs
What is a Satellite Crop Data API?
It is an API that provides high-resolution satellite-based crop monitoring and vegetation analysis, allowing you to track plant health and field performance remotely without being physically present.
Does it support NDVI and EVI indices?
Yes. The API calculates and delivers standard vegetation indices including NDVI (biomass) and EVI (vigor), which help in identifying nutrient deficiencies and overall plant vitality.
Can it analyze crops at the field level?
Yes. Field-level crop analytics are a core feature, allowing you to define specific farm boundaries (polygons) and receive granular health data for each individual plot or management zone.
Does it include climate and drought analysis?
Yes. The API correlates vegetation greenness with moisture levels to provide climate and drought impact analysis, helping you quantify how water stress or heat waves are affecting your crops.
Is GIS visualization available?
Yes. GIS and map-based visualization are fully supported. The API provides data in formats compatible with GIS software (like QGIS or ArcGIS) and web map frameworks to create interactive, color-coded health maps.
Related products
-
AI Image Recognition API – Intelligent Visual Understanding
Original price was: ₹45,000.00.₹30,000.00Current price is: ₹30,000.00. -
Order Tracking API – Real-Time Shipment Tracking
Original price was: ₹45,000.00.₹30,000.00Current price is: ₹30,000.00. -
Speech-to-Text API – Real-Time Voice Transcription
Original price was: ₹45,000.00.₹30,000.00Current price is: ₹30,000.00. -
OCR Text Recognition API – Accurate Text Extraction
Original price was: ₹45,000.00.₹30,000.00Current price is: ₹30,000.00.


Reviews
There are no reviews yet.